Rest of world flees US private debt in Q2 2009
by John Schroy filed under Capital Flow Analysis, Treasuries, Open Market, Agencies, Mortgages, Corporate Bonds, Equities, Fund Shares, Foreign Investors
According to Federal Reserve Flow of Fund tables for Q2 2009 (F.107 Rest of the World), non-US residents are moving out of US private debt instruments, favoring US Treasuries despite record-low interest rates.
The “flight to safety” which started with the Crash of 2009 has accelerated as the economic policies of the Obama administration are becoming evident.
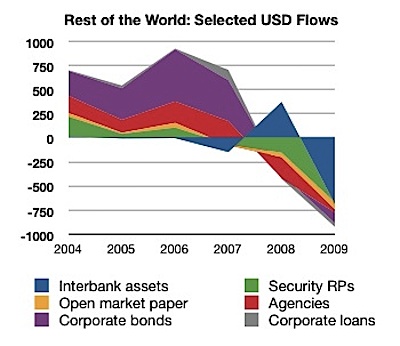
The following graph shows a net swing away from selected private debt accounts on the order of USD !.5 trillion, between 2006 and Q2 2009:
 Fed Flow of Funds Table F.107, US$ billions (annual flows) to Q2 2009
|
||
This movement seems to reflect avoidance of three types of risk:
- OTC counterparty risk: Flight from security repurchase agreements and interbank lending reflects fear of sloppy trading and settlement practices in over-the-counter markets.
- Credit risk: Lack of confidence in the opinions of the traditional credit rating agencies grew even faster, following the Crash of 2008 and combined with the obvious risks of over-leveraging and difficult loan roll-overs due to the credit squeeze, to drive investors out of corporate debt markets.
- Inflation risk: Debt with the strongest credit and most efficient settlement markets cannot withstand a fall in value due to an increased rate of inflation. The Obama administration is doing what it can to scare bond investors away by gargantuan “spending is simulus” packages, passed in the dead of night, written by unknown parties, and unread by legislators or even the President.
Foreign flows to Treasuries and Equities at pre-Crash levels
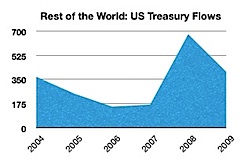
 Foreign net flows to US Treasuries, US$ B, to Q2 2009
|
||
After brief and sharp spikes during the last quarter of 2008, foreign flows into US Treasuries have returned about to the levels of 2004, and about twice the levels of 2005-7.
This seems to indicate that the panic of the Crash of 2008 has already subsided, but that there is no where near the amount of money available from the Rest of the World that would be needed to finance the Obama administration’s “spending is stimulus” packages in order to avoid inflation.
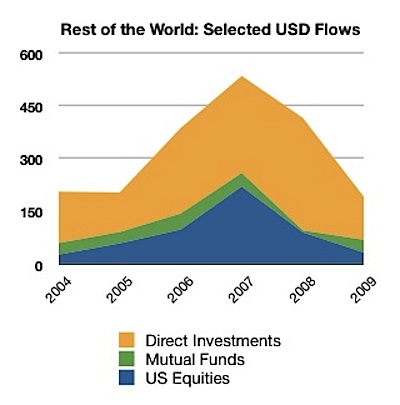
The non-debt foreign investment flows are indicated by the accounts “corporate equities”, “mutual funds”, and “foreign direct investments”.
 Fed Flow of Funds Table F.107, US$ billions (annual flows) to Q2 2009
|
||
These equity-type flows suggest that, following the boom years of 2006-2007, the appetite of the Rest of the World for US non-debt investments has returned to levels similar to those of 2004-2005.
In Q2 2009, foreign flows into US equities (annual basis) were $114.6 billion, compared to issues of foreign equities into the US market of $ 148.9 billion.
This means that by Q2 2009, the Rest of the World was, on balance, avidly avoiding new investment into US equities and private debt, while failing to show enthusiasm for financing the vast Obama stimulus packages which are coming down the road.
With these statistics and the historic importance of foreign investment in the US capital markets, one is left scratching one’s head, wondering why the US stock market was rising throughout the first half of 2009?

 Click these icons to email articles to friends.